
W6W runs a platform for central API management and integration infrastructure. Their users connect to third-party apps through code, a CLI, curl, or whatever else fits the way they already work, then compose those connections into functions and workflows. The platform supports self-hosted and cloud integrations, ships with a package of provided apps, and lets users bring their own or pull from open source.
A platform like that is worth roughly what its catalog is worth. The catalog is what brought W6W to us.
Autonomous API integration at scale means building and shipping third-party connectors without a person driving each step — selection, research, code generation, testing, documentation and review all running as machine work under a policy, rather than as a queue of tickets. W6W contracted ProductiveHub to build that harness against an inventory of thousands of APIs.
One caveat came attached, and it turned out to be the entire design brief: the harness has to operate inside a budget. The budget dictates how many apps get launched. Not the other way around.
Why doesn’t agentic coding scale on its own?
Agentic coding doesn’t scale on its own because generating the code was never the bottleneck. The bottleneck is the human attention wrapped around it — choosing the target, scoping it, steering the build, checking the result — and that cost stays flat per unit no matter how good the code generation gets.
W6W had the evidence in hand. As part of their launch strategy they wanted an ever-growing catalog, starting in the hundreds and climbing past 2,000 base apps. The first burst, roughly 35 apps, was hand-sourced for selected partners: someone looked at what those partners needed to run their operations, picked the relevant endpoints, and built the connectors with Claude Code. The coding was already agentic, and that part worked — it produces good connectors. A previous engagement had taught us the same lesson: generating connector code is the part that’s already solved.
What didn’t scale was everything around it. A person still chose each API, scoped it, steered the build, and checked the result. Human attention stayed the unit of production, so every app cost about what the one before it did. Nothing compounds. You can hire your way to 200 apps like that. You cannot hire your way to 2,000.
So the ask was a harness that runs the whole arc without a person driving each step — selection through launch, documentation and cross-app use cases included, all inside a spending envelope.
That constraint is the interesting part. Cost here is the input that determines output, not something you watch on a dashboard and reconcile at the end of the month. Apps per day is not a target anyone sets; it falls out of how much money is left and what cost-per-app currently is. Getting that relationship right shaped every other decision we made.
What does it mean to treat budget as admission control?
Treating budget as admission control means pricing every job before it starts and declining to admit the ones that no longer fit the remaining envelope. A monitoring approach tells you that you overspent. An admission-control approach declines to start the job that would have overspent. One of those is a report; the other is a decision.
So the first thing we changed was the unit of work. The unit is an integration job, not a conversation. Each job is a DAG of stages with a cost estimate attached before it starts, and a scheduler admits jobs from the queue only while projected spend still fits the remaining envelope. Everything else in the architecture follows from that reframe.
We built the harness to be self-improving, so each cycle makes the app builder cheaper and better without anyone hand-tuning it. Then we ran a second, separate agentic system alongside it for drift detection and QoW/QoP monitoring — quality of work and quality of process. A system that optimizes itself is exactly the kind of system that can quietly optimize itself in the wrong direction, reporting excellent metrics the whole way down.
The weekly envelope
W6W agreed to ProductiveHub’s recommendation to target a weekly budget rather than a monthly one: a tighter control loop, a bad week that can’t quietly eat a quarter, and unspent budget rolling into the next batch on a cadence short enough to actually steer.
A percentage n of the base weekly budget is held back as reserve; the rest is the dev allocation. That percentage is always computed off the base weekly budget, never off a rollover-inflated one — otherwise the reserve compounds. Unused reserve rolls forward into the next week’s dev allocation, so week k gets base_dev + rollover(k-1).
The dollar figures below are not W6W’s budget. They’re a round base — $1,000, with n = 10% — chosen because the arithmetic is legible:
| Week | Dev alloc | Reserve | Actual spend | Reserve drawn | Rolls over |
|---|---|---|---|---|---|
| 1 | $900 | $100 | $910 | $10 | $90 |
| 2 | $990 | $100 | $1,010 | $20 | $80 |
| 3 | $980 | $100 | — | — | — |
The total ceiling in any week is dev_alloc + reserve — $1,090 in week 2 above.
Two decisions we left open
Two parts of the budget model are still recorded in our design notes as open decisions with a recommendation attached, rather than as settled behavior. They’re worth showing as they stand.
Underspend on the dev line. The rule as specified rolls forward only unused reserve. Using the same example: if a week spends $600 of a $980 dev allocation, the $380 evaporates. Reserve-only rollover is simple and predictable, but it penalizes efficiency gains at exactly the moment they start working. Capped total rollover rolls unused dev money too, capped at something like 25% of base weekly, so a slow week can’t create a spending spike later. We recommend the capped version — the whole point of the improvement loop is that cost-per-app falls, and the budget model should let the client convert that into more apps rather than into a forfeited surplus.
Reserve exhaustion. When the reserve hits zero mid-week, our recommended behavior is: hard stop on admitting new jobs, let in-flight jobs finish since that money is already sunk, no rollover, and page a human. Explicitly no borrowing against next week. That is how a one-week overrun turns into a structural deficit.
Guardrails
Three guardrails sit underneath all of it. A per-job cost ceiling stops any single API consuming more than roughly 5% of the weekly envelope; breaching it kills the job and files it as too_expensive for human review. A daily pace target of remaining_budget / days_remaining, with tolerance, keeps spend even. And failed spend is tracked separately, because money burned on jobs that never shipped is the honest measure of whether the improvement loop is doing anything.
How does the integration harness work?
The harness ProductiveHub delivered is a nine-stage pipeline sitting behind that admission gate.
The pipeline
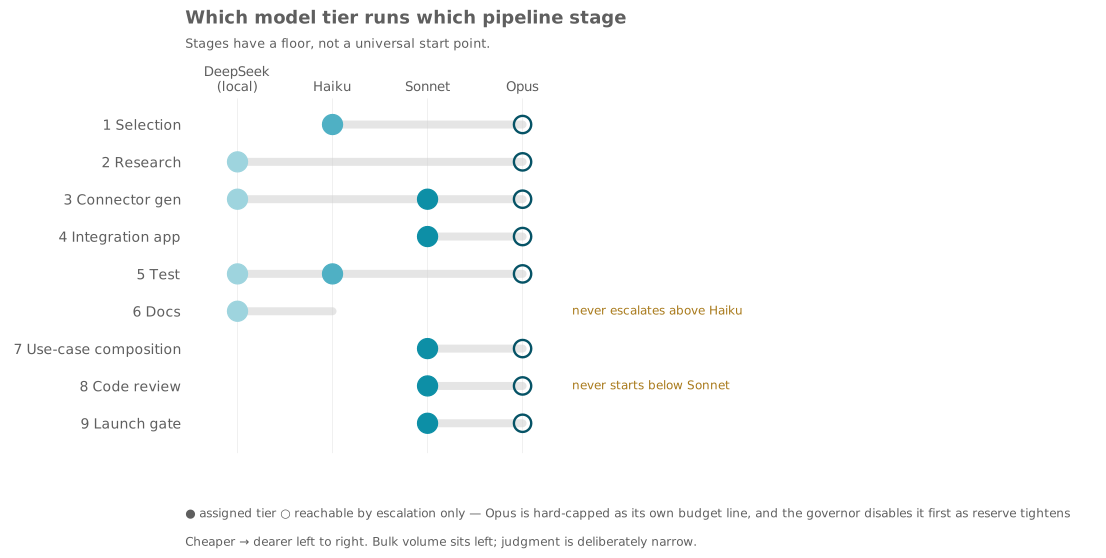
Nine stages, each independently retryable, independently priced, and independently model-routed.
| # | Stage | Output |
|---|---|---|
| 1 | Selection | Ranked candidate APIs from inventory |
| 2 | Research | Docs, OpenAPI/Postman specs, SDKs, changelogs → normalized internal spec |
| 3 | Connector gen | Auth, pagination, rate limits, error taxonomy, schema mapping |
| 4 | Integration app | Customer-facing surface |
| 5 | Test | Contract tests vs. spec, sandbox calls, replay fixtures |
| 6 | Docs | Generated from the normalized spec, not from the code |
| 7 | Use-case composition | Cross-app workflows against the graph of shipped connectors |
| 8 | Code review | Separate model, adversarial framing |
| 9 | Launch gate | Ship / hold / kill |
Two deserve a note. Docs are generated from the normalized spec rather than from the generated code, so they describe the API’s actual contract instead of whatever the connector happened to implement. And code review runs on a separate model with an adversarial framing, because a model reviewing its own output marks generously.
Model routing: open weight for volume, commercial for judgment
We route by stage character, not by preference.
| Tier | Model | Used for |
|---|---|---|
| Bulk | DeepSeek (local) | Doc scraping and chunking, spec normalization, schema mapping, test fixture generation, doc drafting, classification and triage, retry-reason labelling |
| Cheap judgment | Haiku | Routing decisions, structured extraction, validation passes, PR summaries, selection pre-filter, escalation triage |
| Real judgment | Sonnet | Connector architecture for non-trivial APIs, integration app code, adversarial code review, use-case composition, launch gate |
| Break glass | Opus | Escalation only — two failed Sonnet attempts on the same stage, or a supervisor-flagged anomaly. Hard-capped as its own budget line. |
The escalation ladder runs DeepSeek → Haiku → Sonnet → Opus, but stages have a floor rather than a universal start point. Code review never begins below Sonnet. Doc drafting never escalates above Haiku. Escalations are logged as first-class events and charged to the job that caused them — a job that escalates twice is telling you something about the API, not about the model.
The Opus governor disables the top tier automatically once reserve utilization crosses a threshold. That ordering is deliberate: a budget squeeze should degrade to “ship fewer apps,” never to “ship worse apps.”
The ladder also runs downward, which is where most of the cost lever lives. We didn’t fix a target token mix at design time. It gets discovered.
The usage audit file
Every harness run emits an append-only JSONL usage file, one record per model call. It is the source of truth — the accountant reads nothing else, and the improvement loop segments it.
A few fields carry more weight than they look. segment_id is what makes the improvement loop possible at all, because the log has to be segmented at write time; reconstructing segments afterward doesn’t work. agent_version pins every record to the instruction set that produced it, and without it no before/after comparison is defensible. cached_input_tokens is broken out separately, because prompt caching materially changes the arithmetic on a pipeline that re-reads the same pattern library every job. failure_class uses a controlled vocabulary, not free text. And records are written during the run, so a crashed run is still accounted for.
Pricing self-hosted inference honestly. Running DeepSeek locally means there is no per-token price, so cost has to be derived: $/1k tokens = (GPU $/hr ÷ 3600) × (gpu_seconds ÷ tokens) × 1000. We amortize idle GPU time across the week’s actual token volume and re-derive the effective rate weekly. Skip this and the open-weight tier looks free, which makes every downgrade recommendation the loop produces unjustified. A half-idle cluster can genuinely cost more per token than Haiku.
The accountant
A cron process — nightly at minimum, hourly during active batches. It reads the usage JSONL, prices it against a config-driven rate table (prices change; never hardcode them), writes to the ledger, and then, unlike most reporting jobs, acts.
It reports spend sliced by week, day, job, stage, model, agent, and agent version; cost per shipped app and cost per failed app; token mix and spend mix across open-weight and commercial, plus drift in both; cache hit rate and dollars saved by caching; estimate-versus-actual variance per stage and archetype; and reserve draw with projected rollover.
Then it decides. It sets admission control for the rest of the week from remaining budget, days left, and the calibrated cost-per-app estimate. It lowers the escalation ceiling as reserve utilization rises, Opus off first. It recalibrates the cost model from actual variance — the least glamorous and most valuable thing it does. It reweights selection, so realized cost-per-app feeds back into stage 1 ranking and expensive archetypes down-rank on their own. And it holds a kill switch for reserve exhaustion, per-job ceiling breaches, or a cost-variance anomaly. Actual spend running past 3× estimate on three consecutive jobs usually means something upstream broke, not that the APIs got harder.
The division of authority matters: the accountant is advisory on quality and authoritative on money. It can stop the pipeline. It cannot approve a launch.
How does a self-improving agent pipeline actually improve?
By grading its own execution logs and promoting only what measurably worked — not by rewriting its own prompt. It’s a structured, evidence-gated loop over segmented logs, and every change has to survive an A/B test on a held-out set before it ships.
Each dev agent’s log is cut into semantically meaningful segments — auth negotiation, pagination discovery, schema mapping, error-path handling, test scaffolding. Segments are the unit of analysis, because a whole-run log is far too coarse to learn from. Each segment is graded on measured efficiency rather than asserted efficiency: tokens burned, retries, tool calls, wall time, and whether its output survived downstream review unchanged. Where one approach consistently beats another on the same segment type, we promote it into the agent’s standing instructions. Where an approach consistently wastes tokens, we encode it as an anti-pattern.
Segment grades alone would overfit to the harness’s opinion of itself, which is not a neutral source. So they’re fused with external signal: user feedback on shipped connectors, post-deploy metrics such as real-traffic error rates, latency, connector churn and support tickets, and return on tokens spent — apps shipped, and apps retained, per dollar.
Changes are emitted as small versioned instruction deltas rather than periodic rewrites, because many small validated changes beat one large unvalidated one and each is individually reversible. Every delta is A/B’d against the current agent version on a held-out golden set before promotion. A delta that improves cost but degrades post-deploy quality is rejected, not silently traded off.
The downgrade recommender
The main lever on cost is a distinct output of the same loop. For each call site it asks one question: given the observed distribution of outcomes here, does the lower tier produce equivalent results?
Opus → Sonnet usually becomes available once the failure that triggered the escalation is encoded as a pre-flight check. Sonnet → Haiku once the pattern library holds enough worked examples that the task becomes retrieval and adaptation rather than design. Haiku → DeepSeek for anything that has gone mechanical — structured extraction, normalization, fixture generation.
Demotions are proposed on evidence, shadow-tested with both tiers running and outputs compared, then promoted only if quality holds across a statistically meaningful sample. Any demoted call site is re-evaluated on regression: if quality drops after promotion, it auto-reverts and locks at the higher tier for a cooling period. That’s the mechanism migrating the token mix toward local open weight without anyone hand-editing a routing table.
What accumulates
The connector pattern library is the big one — every shipped connector becomes a retrieval example tagged by auth type, pagination style, and error convention. Late in a program you have hundreds of worked examples; in cycle one you have zero. That accumulation is what makes DeepSeek viable for work that needed Sonnet at the start. Alongside it: a failure taxonomy feeding pre-flight checks, so known failure classes get caught before money is spent; versioned, diffable agent instruction sets, each traceable to the evidence that produced it; and the accountant’s cost model calibration.
The claim the whole loop stands on is narrow and falsifiable: cost per shipped app falls week over week at constant or rising quality. If it doesn’t, the loop is decorative.
How do you stop a self-improving system from drifting?
You watch it from outside, because a self-improving system cannot audit itself — its own metrics are the thing that drifted. The supervisor runs out-of-band, on a separate model and, importantly, a separate budget line, so it can’t be starved by the thing it’s watching.
QoW (quality of work) tracks test pass rates, review findings per KLOC, doc completeness, post-launch error rates from real traffic, and connector churn. QoP (quality of process) tracks escalation rate, retries per job, cost variance against estimate, stage latency, and model mix drift.
Drift detection periodically replays a fixed golden set of APIs and compares against baseline over a sliding window. Drift shows up as cost-per-app creeping up or quality creeping down while the pipeline still reports green — a pattern library poisoned by one bad shipped connector, or an instruction delta that looked good on segment metrics and is quietly worse in production. Those are the failure modes a self-improving system is uniquely exposed to, and they’re invisible to the system’s own metrics by construction.
The supervisor can pause the pipeline, roll back the last instruction delta, and force-escalate a demoted call site. It has a kill switch, not just a dashboard.
Results: 10 to 152 apps a week
A single throughput figure is the wrong shape for this system, because the figure keeps moving.
The first three weeks were still mostly hand-driven — someone scoping candidate APIs and steering the agents while the harness itself was being built and tested — and throughput moved the way hand-driven work moves: 10 apps in week one, 12 in week two, 14 in week three. Flat.
Week four is when the harness launched. Throughput went to 36 that same week, on the same budget, with nobody driving individual jobs. Then 62. Then 74. Then 126. Then 152. Five different “current numbers” in five consecutive weeks, with no manual retuning between any of them.
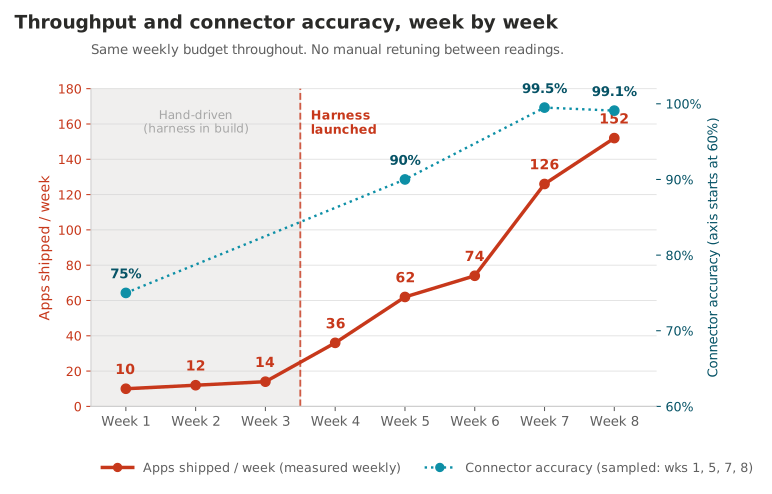
Speed on its own is cheap to buy — you just lower the bar. So the number to read alongside it is connector accuracy: the share of shipped connectors that passed contract tests and post-deploy validation without a human fix. That ran about 75% in week one, roughly 90% in week five, and about 99.5% in week seven, while throughput was multiplying underneath it. Accuracy is sampled rather than measured every week, which is why it’s plotted as four points on the chart above and not as a weekly series.
Week eight is where it gets interesting. Accuracy came in at 99.1% — a slight dip from week seven, in the same week throughput hit its highest reading yet. Half a point on a golden-set replay sits well inside normal run-to-run variance, and it’s almost certainly noise. We’re leaving it on the chart anyway, because it is also the first data point in this series that the out-of-band supervisor exists to catch: a small quality wobble at record throughput. Through week seven, speed and quality moved together on a flat budget. Week eight is where we start watching rather than narrating.
How the curve is defended
A climb this steep invites three objections — the budget grew, the APIs got easier, and quality got worse — and each has to be answered with instrumentation rather than assurance. The accuracy trend above answers the third.
The first is answered by normalizing: apps shipped per $1,000 spent strips budget out of the comparison entirely, and a waterfall decomposing the gain into budget increase, cost-per-app reduction via tier demotion, fewer retries and escalations, and lower failed spend shows where it actually came from. That decomposition can come back with an uncomfortable answer, which is precisely why it’s worth running. If most of the gain came from budget rather than efficiency, the honest move is to say so — the number is still real, it’s just a different claim.
The second is answered by golden-set replay: cost and quality tracked on a fixed set of APIs over time. It’s the strongest evidence in the set because the input is held constant by construction, so selection bias cannot explain the curve. It only works if the golden set was instrumented from week one, which is why that’s the first thing we’d set up again.
Two caveats worth stating plainly. Human intervention rate per shipped app belongs on the same axis as cost — if it didn’t fall alongside cost, throughput was bought with reviewer hours that never show up in the token budget. And eight weekly readings is a trend, not a law. We don’t know where this curve levels off, or whether it does before the API inventory itself becomes the constraint. Treat 152 the way we now treat 62: as the most recent reading, not the answer.
What we’d carry forward
Two things we’d move earlier on the next build of this kind.
Instrument the golden set, the archetype tags, and the post-deploy metrics from week one. They cost very little to capture up front and cannot be recovered later. A retrofitted baseline is the fastest way to lose a technical audience, and it costs more credibility than the missing chart would have bought. Everything that makes an efficiency claim defensible depends on a baseline that existed before anyone knew the result.
Price self-hosted inference honestly from the start. If the local tier looks free in the ledger, the downgrade recommender is optimizing against a fiction, and every demotion it proposes is unjustified — including the ones that happen to be correct.
Conclusion
W6W needed a catalog that grows without growing linearly in human attention, inside a budget. What ProductiveHub built treats those as the same problem. Making cost an admission-control decision rather than a monthly report lets the pipeline run close to its envelope without breaching it; segmenting execution logs at write time lets the system learn where its money actually goes; and putting an independent supervisor on its own budget line keeps a self-improving system from improving itself somewhere nobody wanted it to go.
The throughput curve is the part that fits on a slide, and it’s out of date by the time it’s printed. That’s a property of a self-improving system, not a flaw in the reporting. The part worth keeping is the machinery that makes the curve arguable — the fixed golden set, the failed-spend line, the quality metrics plotted on the same axis as cost. Autonomous API integration at scale isn’t hard because generating a connector is hard. It’s hard because staying honest about what the connectors cost, and what they’re worth once they ship, is the only thing that lets you keep going while the number underneath you keeps changing.
Related: Secure Runtime Server with AI-Powered App Pipeline
Technology Stack
Transform Your Technology Organization
Ready to achieve similar results? Read about our fractional CTO services, or start a conversation about your engagement.
Related Success Stories
Fixing an 800% Cloud Cost Spike from Runaway Multi-Agent AI
28 days after deploying their multi-agent AI, a startup's cloud bill spiked 800%. Their agents had turned—trapped in infinite loops, generating 1.4 million zombie writes per hour. We contained the outbreak and delivered seven survival patterns.
AI Engineering Mesh: Scaling Agent Teams Like Infrastructure
A newly funded AI platform needed to ship an MVP fast — without the chaos that usually comes with 'fast.' We built a dynamically scaling mesh of Claude-powered agent clusters with a stakeholder map that knows exactly who to call, when, and why.