
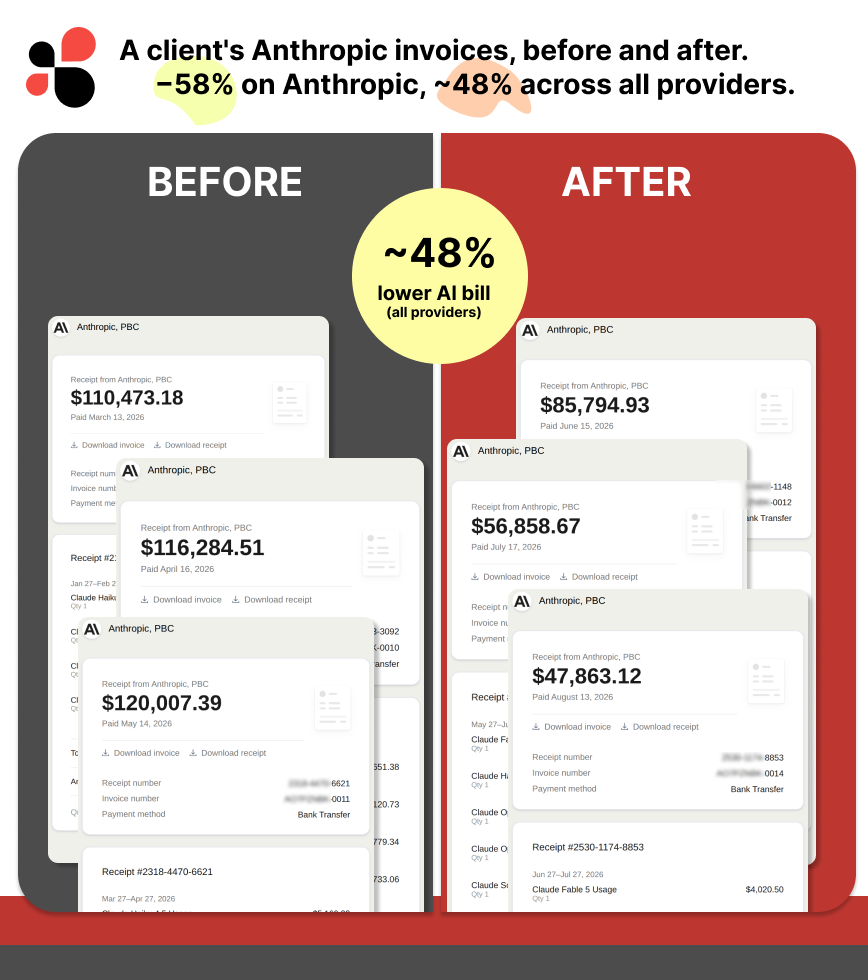
Anthropic receipts for the three billing cycles before the engagement (left) and the first three after it (right). By cycle 5, Anthropic spend is 58% lower and total provider spend is 47.7% lower.
We reduced the client’s AI costs by lowering the cost of completing each task: routing work to models that met the quality requirement, trimming unnecessary context, and moving suitable steady workloads to on-prem GPUs.
That was ProductiveHub’s approach for a YC-backed startup that had recently raised a Series A. Its client base was expanding, and AI spending was putting pressure on runway. The mandate was to keep serving that growth while bringing the cost of delivery down. We organized the work around four steps: measure, route, trim, own.
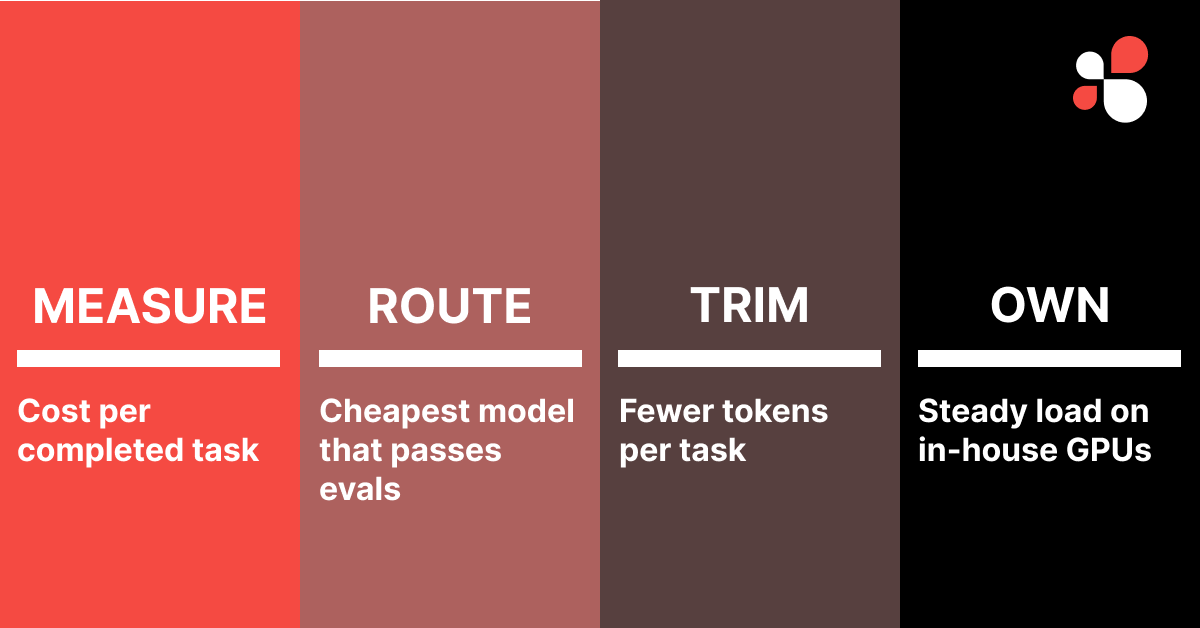
Each step targets a different part of the bill: how cost is measured, which model does the work, how many tokens a task uses, and where steady work runs.
The spending figures below move from $230,017.83 to $120,283.63 per billing cycle, a 47.7% reduction. The Anthropic model breakdown makes one improvement track concrete: Opus falls from 80.6% to 29.1% of that provider’s spend as the allocation shifts toward Sonnet and Haiku.
The client base kept growing over the same period, so AI spend per customer fell by more than the headline 47.7%. That saving recurs every month a customer stays, and it changes the economics of growth: each new client adds margin instead of drawing down runway.
About the figures: Commercial provider spending and model allocations are verified against invoices. Savings are calculated from those verified amounts. Provider-bill reductions exclude on-prem hardware and operating costs; they are not net savings.
Why were AI costs outgrowing the business?
The product used frontier models by default, including for work that could potentially pass on a cheaper model. Every new client added tasks, and there was no per-task cost ledger to show which calls needed that capability.
At baseline, Anthropic accounts for about $120,000 a month, OpenAI $80,000, and other providers $30,000 combined. Before the engagement, total spend rises from $212,237.74 to $224,081.41 and then $230,017.83: increases of 5.6% and 2.6% across consecutive cycles.
Using several providers had not solved the underlying problem. We needed a way to decide what each task required, measure what it consumed, and check whether a less expensive path still met the quality bar.
How did we reduce AI costs without cutting usage?
We worked on the cost per completed task while keeping quality as a release requirement. A useful planning model is provider spend ≈ effective price per token × tokens per task × task volume. Actual accounting needs separate rates for input, output, and cached tokens, plus any retries and other billed usage.
The four steps address different parts of that cost:
| Step | What changes | What to measure |
|---|---|---|
| Measure | Attribute calls and retries to a task | Cost and quality per completed task |
| Route | Select models using task evaluations | Model mix, effective token cost, and eval results |
| Trim | Reduce unnecessary input, output, and repeated work | Tokens per task and retry counts |
| Own | Run suitable steady workloads on in-house GPUs | Total serving cost, including hardware and operations |
Measure — know what every task costs
We gave every task and sub-task an ID and recorded its model, token usage, and elapsed time. That ledger let us identify expensive workflows and compare their cost before and after a change.
The useful unit is a successfully completed task. A cheaper call can become more expensive overall if it needs repeated attempts or produces work that has to be redone. Task-level attribution makes those costs visible when evaluating routing and context changes.
Route — eval-backed model routing pays the right price per call
We built a router that selects a model for each task using evaluation results. A cheaper model becomes eligible when it passes the relevant evals; work that needs a more capable model keeps access to one.
The evaluations run against fixed benchmarks, user and stakeholder feedback, and candidate models. They also provide the release gate for context trimming and self-hosted inference. When a task fails, the system can retry on another model within a bounded retry budget.
We also enabled prompt caching for reusable prompt content. Caching and routing address different costs: routing changes which model handles a call, while caching reduces charges for eligible repeated input. The Anthropic model breakdown below illustrates the routing track within the wider optimization.
Trim — send fewer tokens per task
We identified sub-tasks that could run in separate agents with only the context needed for that work. The engagement brief reports 30% less context per prompt on average following this change.
We added automatic compaction with thresholds by task type and a vector database for retrieving relevant work from earlier sessions. Output-token limits and caps on loops and retries bounded how much a task could consume.
A 30% reduction in context is not a 30% reduction in the whole bill. Output tokens, cache behavior, model selection, additional calls, and task volume all affect the final cost. We used the per-task ledger to evaluate the combined effect.
Own — move steady load to on-prem open-weight models
We built on-prem GPU racks and moved suitable, predictable workloads to models running in-house — mostly DeepSeek and Qwen, alongside models supplied by the client. Commercial providers remained available for work that needed them to pass the evaluations.
The hardware build was part of the cost engineering too. We assembled the racks using a mix of second-hand components sourced from liquidation sales and new parts. We’ll share how we sourced the components and put the racks together in a build series over the coming weeks.
This moves part of the cost from API charges to hardware and operations. It can make economic sense when utilization is sufficient, but the comparison must include hardware amortization, power, hosting, maintenance, and engineering time. Our W6W integration harness case study explains how we assign a cost to self-hosted inference.
The on-prem launch coincides with the largest cycle-to-cycle reduction in the breakdown: $50,202.16 between cycles 1 and 2. Router and harness updates shipped in the same cycle, so that entire reduction cannot be attributed to the GPUs alone.
Moving integrations from Zapier and n8n to W6W
Alongside the model and infrastructure changes, we migrated the client’s integrations from Zapier and n8n to W6W. We used W6W to connect their workflows to both internal and external APIs, covering the client’s own systems and third-party services.
How much did AI provider spending drop, and how fast?
In the breakdown, provider spend drops 21.5% in cycle 1, reaches 48.4% below baseline in cycle 3, and ends at 47.7% below baseline in cycle 5. The last three cycles range from $118,643.47 to $127,425.45. The improvement persists through fluctuations in spending.
Cycle 0 is discovery and the baseline. The router and evals launch in cycle 1; on-prem inference and further router and harness updates launch in cycle 2. Cycles 3–5 reflect continued refinement. These overlapping changes mean the timeline cannot isolate the dollar contribution of each intervention.
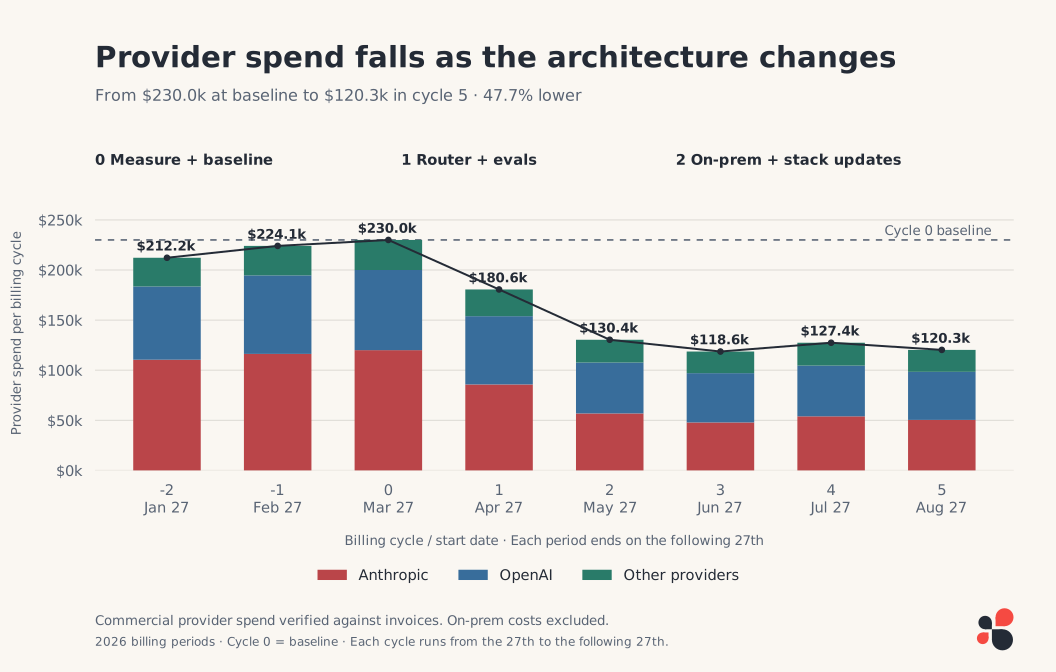
Provider spend by cycle, split across Anthropic, OpenAI, and other providers. The dashed line holds cycle 0 spending constant for comparison; it is not a forecast.
Billing periods and savings calculation
Each billing period runs from the 27th to the following 27th. The ending boundary belongs to the next cycle, avoiding double-counting. Cycles −2 and −1 precede the engagement; the six-cycle comparison covers 0–5. Cycle 5 ends September 27.
| Cycle | Billing period (2026, end exclusive) | Provider spend | Reduction vs. cycle 0 | Difference vs. baseline |
|---|---|---|---|---|
| -2 | January 27–February 27 | $212,237.74 | — | — |
| -1 | February 27–March 27 | $224,081.41 | — | — |
| 0 | March 27–April 27 | $230,017.83 | 0.0% | $0.00 |
| 1 | April 27–May 27 | $180,591.73 | 21.5% | $49,426.10 |
| 2 | May 27–June 27 | $130,389.57 | 43.3% | $99,628.26 |
| 3 | June 27–July 27 | $118,643.47 | 48.4% | $111,374.36 |
| 4 | July 27–August 27 | $127,425.45 | 44.6% | $102,592.38 |
| 5 | August 27–September 27 | $120,283.63 | 47.7% | $109,734.20 |
| Cycles 0–5 total | March 27–September 27 | $907,351.68 | 34.3% across six cycles | $472,755.30 |
Holding the $230,017.83 baseline flat for six cycles gives $1,380,106.98. Subtracting the $907,351.68 spend gives $472,755.30 less provider spend across the period. That is a 34.3% cumulative reduction; the headline 47.7% compares only cycle 5 with cycle 0.
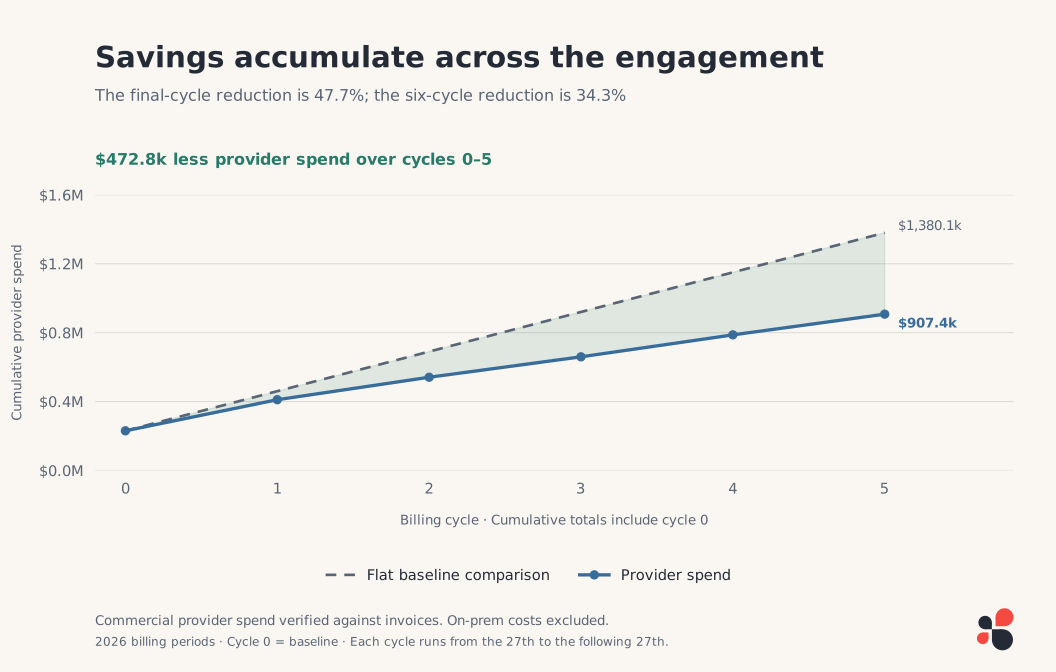
The gap accumulates as each cycle spends less than the baseline. Both lines include cycle 0; neither includes on-prem hardware or operating costs.
The comparison does not assume spending would keep growing, and it does not establish what the client would have spent without the changes. Multiplying the final cycle’s $109,734.20 difference by 12 gives $1,316,810.40 in annualized provider savings. That is a run-rate calculation, not a year of realized savings, and it excludes on-prem costs.
Which providers account for the reduction?
Anthropic contributes $69,600.08, or 63.4% of the total $109,734.20 reduction between cycles 0 and 5. OpenAI contributes $32,027.58 and other providers $8,106.54.
| Provider | Cycle 0 | Cycle 5 | Reduction per cycle | Change |
|---|---|---|---|---|
| Anthropic | $120,007.39 | $50,407.31 | $69,600.08 | -58.0% |
| OpenAI | $80,009.17 | $47,981.59 | $32,027.58 | -40.0% |
| Other providers | $30,001.27 | $21,894.73 | $8,106.54 | -27.0% |
| Total | $230,017.83 | $120,283.63 | $109,734.20 | -47.7% |
Anthropic’s larger contribution makes its model mix a useful example of how the optimization works. Provider totals alone do not separate routing, context reductions, caching, and work moved in-house.
View the provider breakdown for every billing cycle
| Billing cycle | Anthropic | OpenAI | Other providers | Total |
|---|---|---|---|---|
| -2 | $110,473.18 | $73,108.62 | $28,655.94 | $212,237.74 |
| -1 | $116,284.51 | $78,390.07 | $29,406.83 | $224,081.41 |
| 0 | $120,007.39 | $80,009.17 | $30,001.27 | $230,017.83 |
| 1 | $85,794.93 | $68,136.12 | $26,660.68 | $180,591.73 |
| 2 | $56,858.67 | $50,797.33 | $22,733.57 | $130,389.57 |
| 3 | $47,863.12 | $49,208.45 | $21,571.90 | $118,643.47 |
| 4 | $53,947.38 | $50,662.81 | $22,815.26 | $127,425.45 |
| 5 | $50,407.31 | $47,981.59 | $21,894.73 | $120,283.63 |
| Cycles 0–5 total | $414,878.80 | $346,795.47 | $145,677.41 | $907,351.68 |
How did the Anthropic model mix change?
The allocation shifts from Opus at 80.6% of Anthropic spend in cycle 0 to 29.1% in cycle 5. Sonnet and Haiku together rise from 19.4% to 68.3%. Their combined spend increases even as the overall Anthropic bill falls 58%.
This is one improvement track within the wider engagement: routing gives more of the budget to models that can meet the task’s quality requirement at a lower cost.
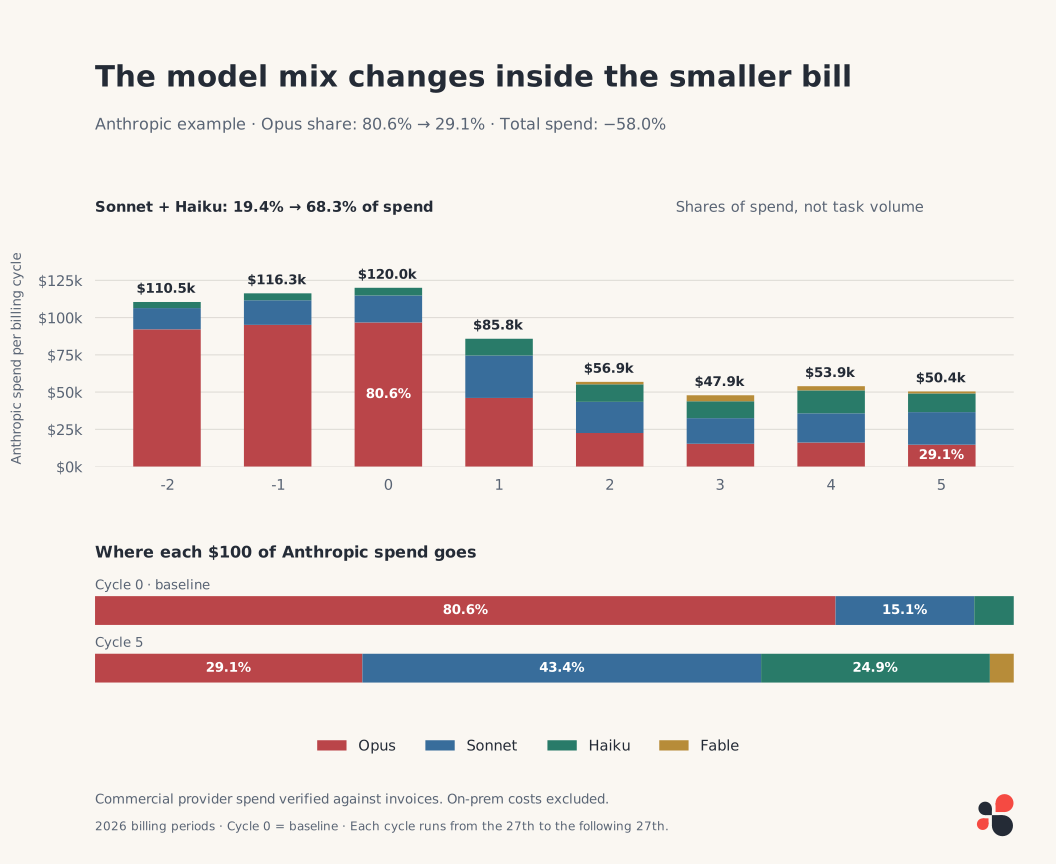
The upper chart shows dollar spend over time. The lower bars divide each $100 of Anthropic spending by model family at baseline and in cycle 5. These are spending shares, not shares of tokens, requests, or completed tasks.
A worked routing example: cycle 0 to cycle 1
The first routing cycle makes the mechanism particularly clear:
- Opus: $96,725.96 → $46,071.88, a decrease of $50,654.08.
- Sonnet: $18,121.11 → $28,483.91, an increase of $10,362.80.
- Haiku: $5,160.32 → $11,239.14, an increase of $6,078.82.
- Anthropic total: $120,007.39 → $85,794.93, a net decrease of $34,212.46, or 28.5%.
The additional $16,441.62 allocated to Sonnet and Haiku is smaller than the reduction in Opus spend. That is how a routing change can lower the total bill while spending more on selected models.
The allocation illustrates the mechanism; it does not prove routing alone caused that entire reduction. Measuring that contribution requires task volume, token counts, cache usage, retries, and evaluation results alongside the spending data.
View the full Anthropic model breakdown
Percentages are each model family’s share of Anthropic spend within that cycle. The totals cover cycles 0–5 only.
| Billing cycle | Fable | Opus | Sonnet | Haiku | Anthropic total |
|---|---|---|---|---|---|
| -2 | — | $92,134.63 (83.4%) | $14,251.04 (12.9%) | $4,087.51 (3.7%) | $110,473.18 |
| -1 | — | $95,120.73 (81.8%) | $16,512.40 (14.2%) | $4,651.38 (4.0%) | $116,284.51 |
| 0 | — | $96,725.96 (80.6%) | $18,121.11 (15.1%) | $5,160.32 (4.3%) | $120,007.39 |
| 1 | — | $46,071.88 (53.7%) | $28,483.91 (33.2%) | $11,239.14 (13.1%) | $85,794.93 |
| 2 | $1,648.90 (2.9%) | $22,516.03 (39.6%) | $20,927.17 (36.8%) | $11,766.57 (20.7%) | $56,858.67 |
| 3 | $4,020.50 (8.4%) | $15,316.20 (32.0%) | $17,182.86 (35.9%) | $11,343.56 (23.7%) | $47,863.12 |
| 4 | $2,805.26 (5.2%) | $16,130.27 (29.9%) | $19,630.39 (36.4%) | $15,381.46 (28.5%) | $53,947.38 |
| 5 | $1,310.59 (2.6%) | $14,668.53 (29.1%) | $21,876.77 (43.4%) | $12,551.42 (24.9%) | $50,407.31 |
| Cycles 0–5 total | $9,785.25 | $211,428.87 | $126,222.21 | $67,442.47 | $414,878.80 |
The routing decision also needs revisiting as models improve. For example, Anthropic’s Sonnet 5 release announcement describes performance approaching Opus 4.8 at lower prices. That is a reason to rerun task evaluations; provider benchmarks alone do not establish which model is suitable for a client’s workflow.
What should a team measure beyond AI provider bills?
The engagement brief also reports 30% less context per prompt and 23% higher productivity over the same period. The productivity measurement method is not specified, so we do not use it to calculate savings or claim a measured improvement in output quality.
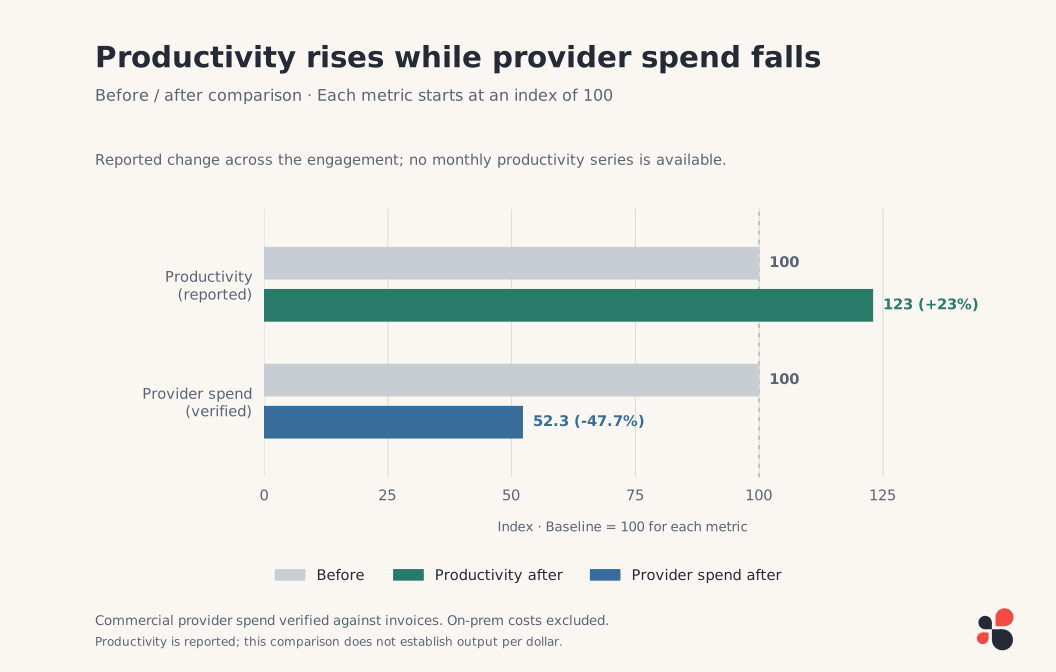
Indexing both starting values to 100 makes their relative changes comparable: reported productivity rises 23%, while provider spend falls 47.7%. Only the before-and-after productivity change is available, so this chart does not plot a monthly productivity trend or establish productivity per dollar.
For a complete economic comparison, track cost per successfully completed task, evaluation results, retries, latency, and the full cost of self-hosted inference. The brief does not provide hardware payback, the share of work moved on-prem, or numerical quality results.
The practical sequence remains measure, route, trim, own. Measurement identifies expensive work; evaluations establish which changes are acceptable; routing and context controls reduce provider charges; and utilization determines whether owning compute improves the economics further.
Frequently asked questions
How do you reduce AI costs without cutting usage?
Measure cost per task, route calls to the lowest-cost model that passes task-specific evaluations, reduce unnecessary context, cache reusable prompt content, and assess self-hosting for steady workloads. Keep quality as a release requirement and compare cost per successfully completed task, including retries.
What is eval-backed model routing?
Eval-backed model routing selects a model for each task using measured output quality and cost. A cheaper model becomes eligible when it passes the task’s evaluations. Benchmarks, user feedback, and evaluation of new model versions inform routing updates; difficult or failed tasks can escalate to another model.
How does context trimming reduce AI costs?
Context trimming removes input tokens a task does not need. We gave delegated agents only relevant context, compacted conversations, and retrieved previous work on demand. The engagement reported 30% less context per prompt on average; that does not mean a 30% reduction in the entire AI bill.
When is self-hosting an LLM cheaper than an API?
Self-hosting can cost less for predictable workloads with enough utilization, provided the model passes the required evaluations. Compare provider charges with hardware amortization, power, hosting, maintenance, and engineering costs per completed task. This case study does not establish a break-even point because hardware and operating costs are not included.
How long did this AI cost optimization take?
In the timeline, provider spend is 21.5% below baseline in cycle 1, 43.3% below in cycle 2, and 48.4% below in cycle 3. Cycles 3–5 remain 44.6–48.4% below baseline, ending at 47.7%. These results describe this engagement, not a guaranteed savings rate or delivery timeline.
Technology Stack
Transform Your Technology Organization
Ready to achieve similar results? Read about our fractional CTO services, or start a conversation about your engagement.
Related Success Stories
Fixing an 800% Cloud Cost Spike from Runaway Multi-Agent AI
28 days after deploying their multi-agent AI, a startup's cloud bill spiked 800%. Their agents had turned—trapped in infinite loops, generating 1.4 million zombie writes per hour. We contained the outbreak and delivered seven survival patterns.
AI Engineering Mesh: Scaling Agent Teams Like Infrastructure
A newly funded AI platform needed to ship an MVP fast — without the chaos that usually comes with 'fast.' We built a dynamically scaling mesh of Claude-powered agent clusters with a stakeholder map that knows exactly who to call, when, and why.